Since solving the first enzyme structure of lysozyme in 1965, the structure and function of an enzyme are thought to be intertwined. Enzymes involved in natural product chemistry also follow this pattern. By understanding the structure of an enzyme, insight into how the target molecule binds, if any co-factors are required for catalysis and potentially the amino acids are needed in the catalytic machinery. Observing the three-dimensional structure of an enzyme is indispensable tool in unravelling the mechanisms by which enzymes involved in natural product chemistry work.
X-ray crystallography determines the arrangement of atoms of a crystalline solid in three dimensional space. By the use of 0.5 to 1.5 angstroms long X-rays, the distance between atoms in a molecule can be observed. However, for the signal to be observable it needs to be amplified by multiple copies of the same molecule arranged in an orderly fashion – a solid crystal.
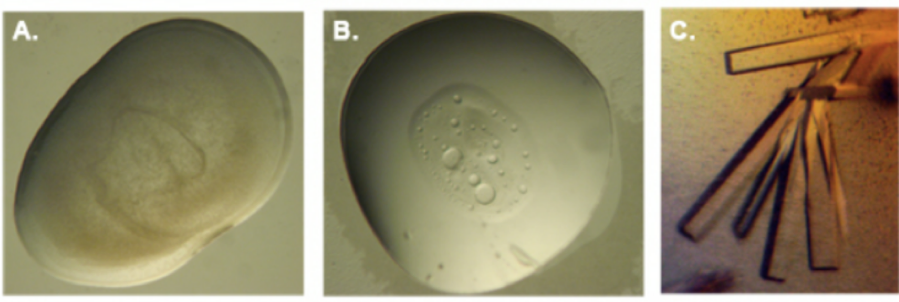 Figure 1: Different outcomes of a crystallization experiment. A: When the aggregation is too fast and uncontrolled, only amorphous precipitate is observed. B: Multiple stages of aggregation can be observed which are not ordered crystals. In this case one can see phase separation which is a partition between the protein and the crystallization medium. Usually this is a considered a good sign, and optimization of the condition can lead to the formation of crystals. C: Protein crystals.
Crystallization of enzymes is as much an art as it is a science. Proteins can precipitate by mixing them with salts, alcohols and other varied solutions. This precipitation can be uncontrolled, leading to amorphous precipitation or controlled, giving rise to a crystal. As there is currently no universal rule for what conditions may give rise to a crystal for any given protein, a large number of conditions need to be tested to identify the best crystallization environment for every enzyme. Patience, and to some extent luck, determines the success or failure of the crystallization for any given protein.
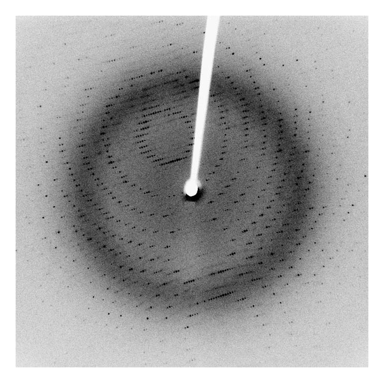
Figure 4: Typical X-ray diffraction pattern. The black dots contain the information necessary to derive the structure of the protein. The white line across the image is the path of the x-ray which always obscures a small amount of data.
Once a suitable crystal is obtained, bombarding it with x-rays yields a diffraction pattern. The accumulation of thousands of such images, for 360º, gives the spatial information of the electrons which are the cause of X-ray diffraction.
When the electron information is available, all that is left is to build the puzzle of the protein structure. You slowly fill the electron density with the amino acids, cofactors, waters and other ligands that best fill the data, until a complete structure is achieved.
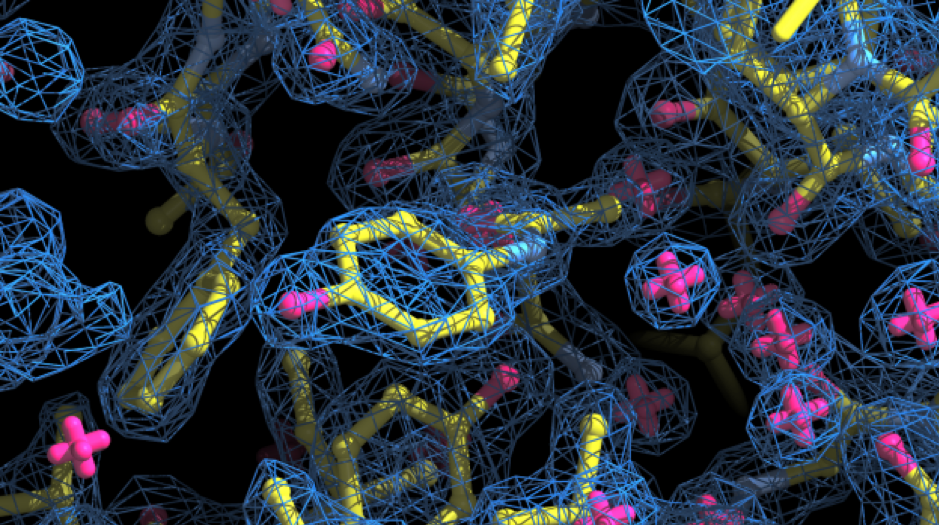
Figure 5: Electron density map obtained from x-ray diffraction pattern. The electron cloud (in blue) contains the shape necessary to correctly allocate the amino acids and ligands present in the crystal.
Updated: May 2018